Our research include investigating storm-driven hydrodynamics and geomorphologic changes of coastal waters to extreme events like hurricanes and storms. Besides, I'm interested in coupling between hydrodynamics and biogeochemical processes happening in the coastal zone, and improving coastal resilience, adaption to extreme events, and coastal hazard mitigation using satellite images, observational data, and numerical simulations.
Costal processes during Hurricane Harvey in 2017
Compound flooding around Galveston Bay, TX, during Hurricane Harvey in 2017 has been reproduced by SCHISM 3D simulations and studied by sensitivity tests to quantify dominance from three major flood drivers, open ocean, river discharge, and precipitation.
To represent more realistic river discharge, SCHISM was coupled with NWM river discharge at land boundary. As a results, more than 6000 rivers were injecting freshwater from land boundary into the model domain.
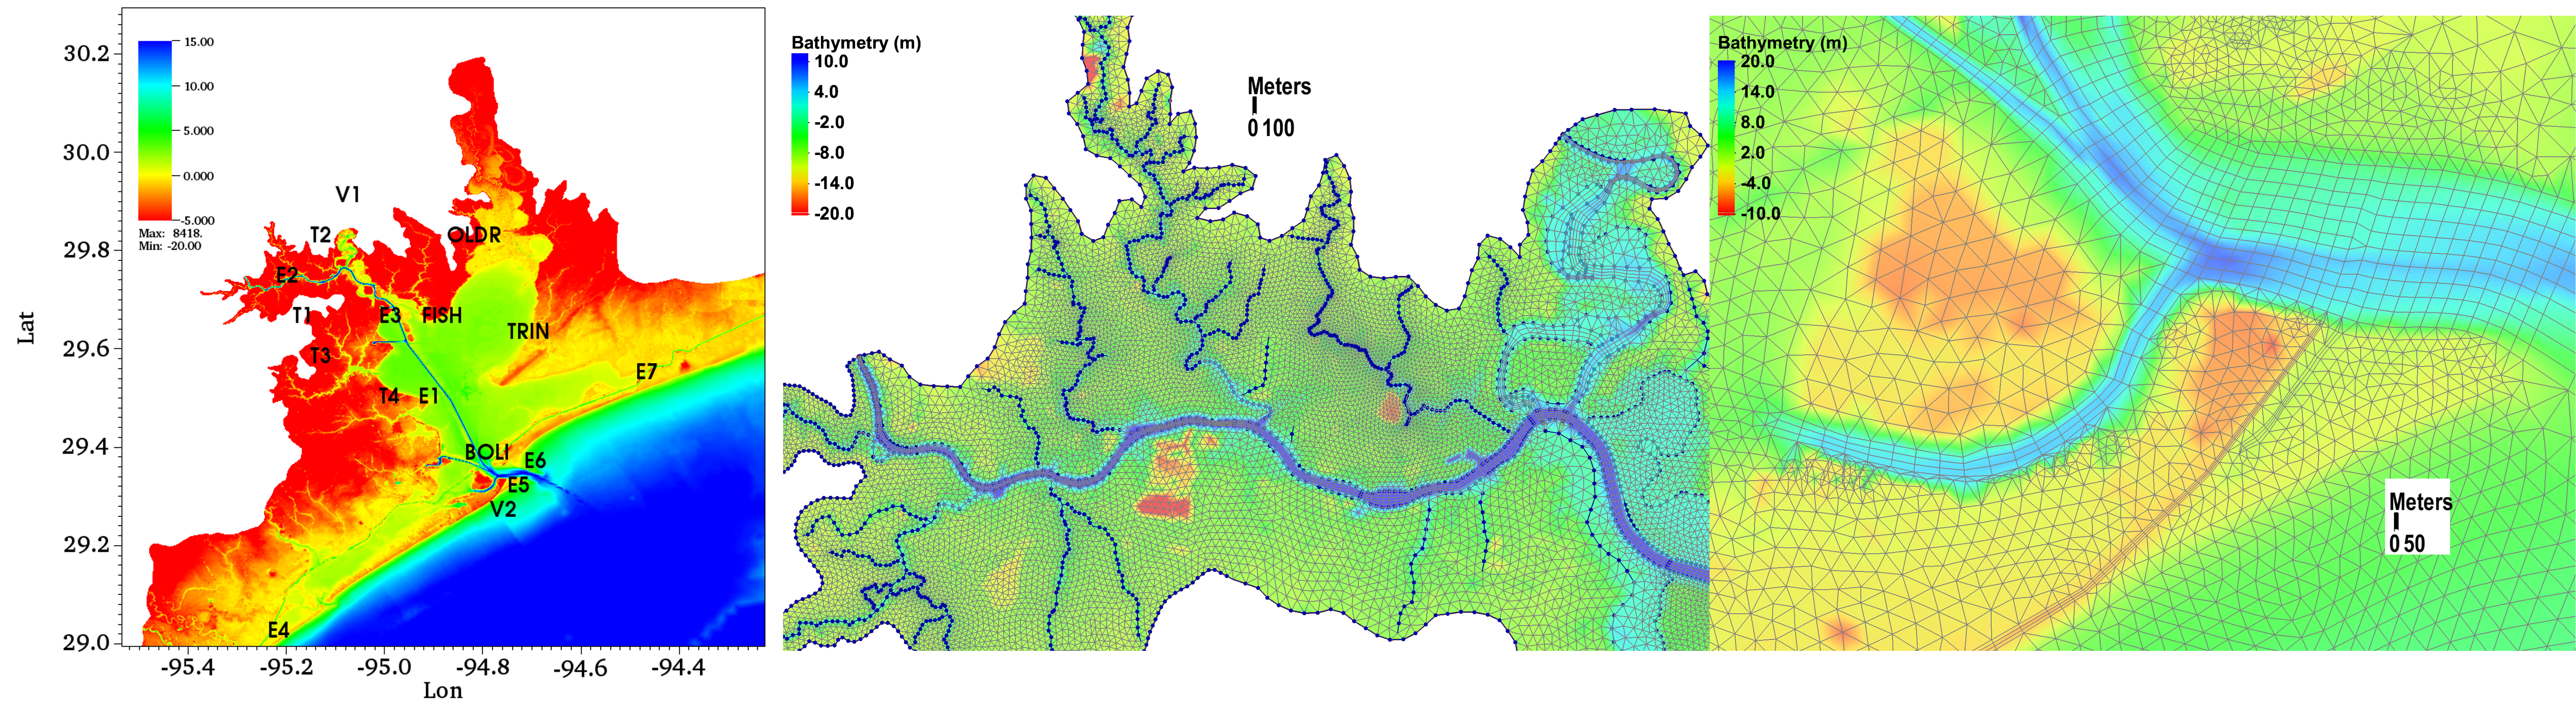
Above figure shows the horizontal grid for Hurricane Harvey simulation and is zoomed in to areas around Galveston Bay in Texas. NWM streams are represented by arcs inside the domain.
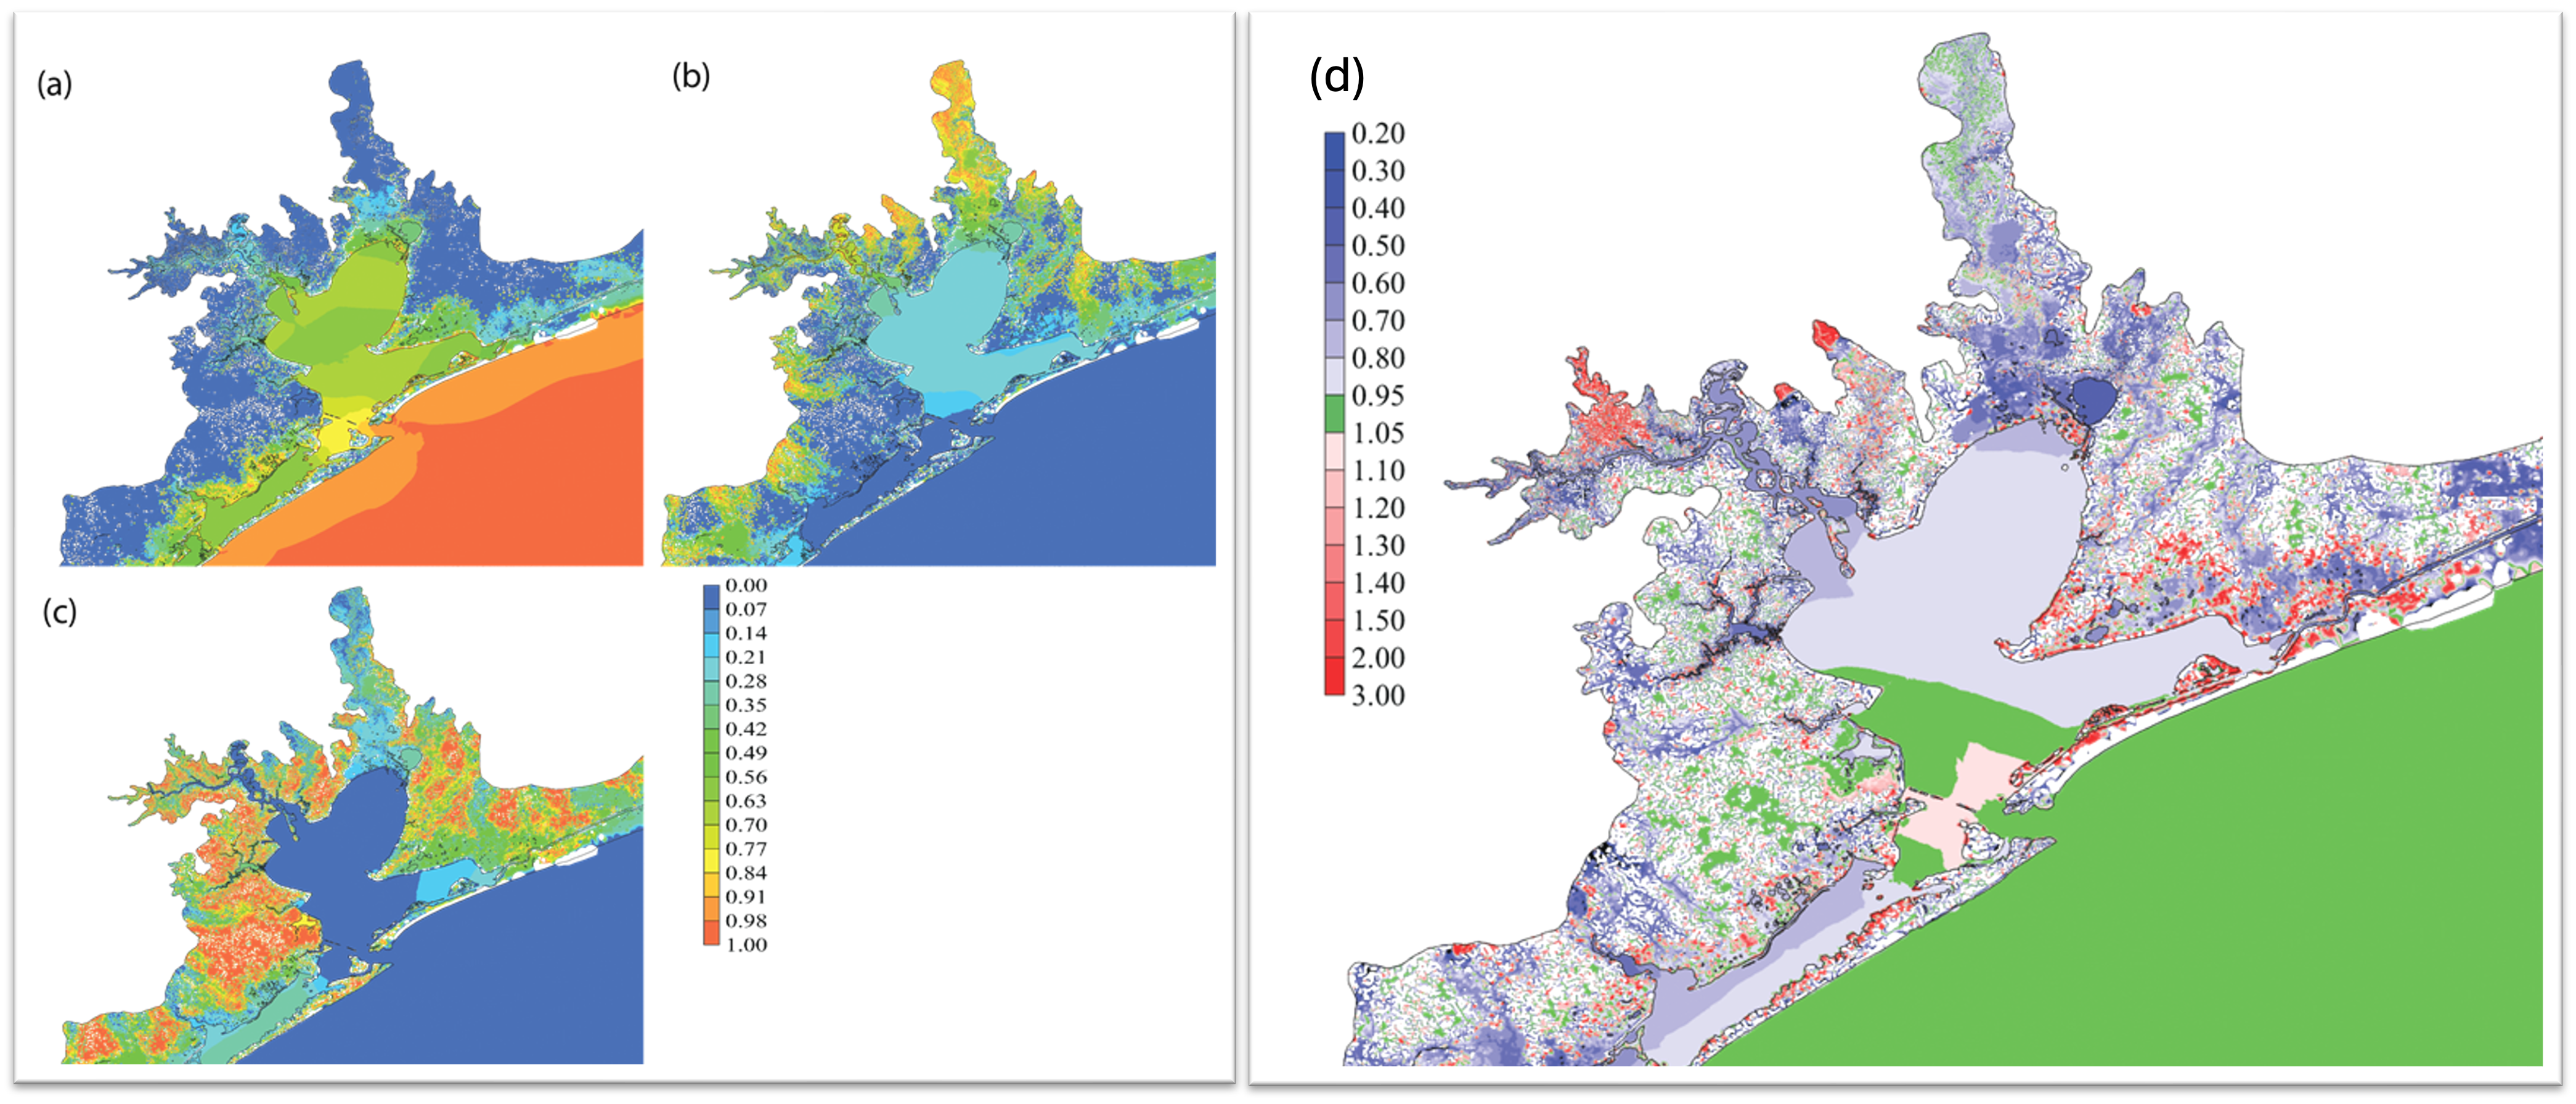
By conducting sensitivity tests, contributions induced by major flood drivers can be quantified and visualized by maps shown below. Any regions other than green indicate non-negligible compound effects in figure (d), which are induced by the combination effects of both three flood drivers (to learn more: https://doi.org/10.1016/j.ocemod.2020.101735).
Coastal processes during Hurricane Irma
Simulation of 3D hydrodynamics of Biscayne Bay and its adjacent waters using SCHISM can reproduce the compound flooding during Hurricane Irma in 2017.
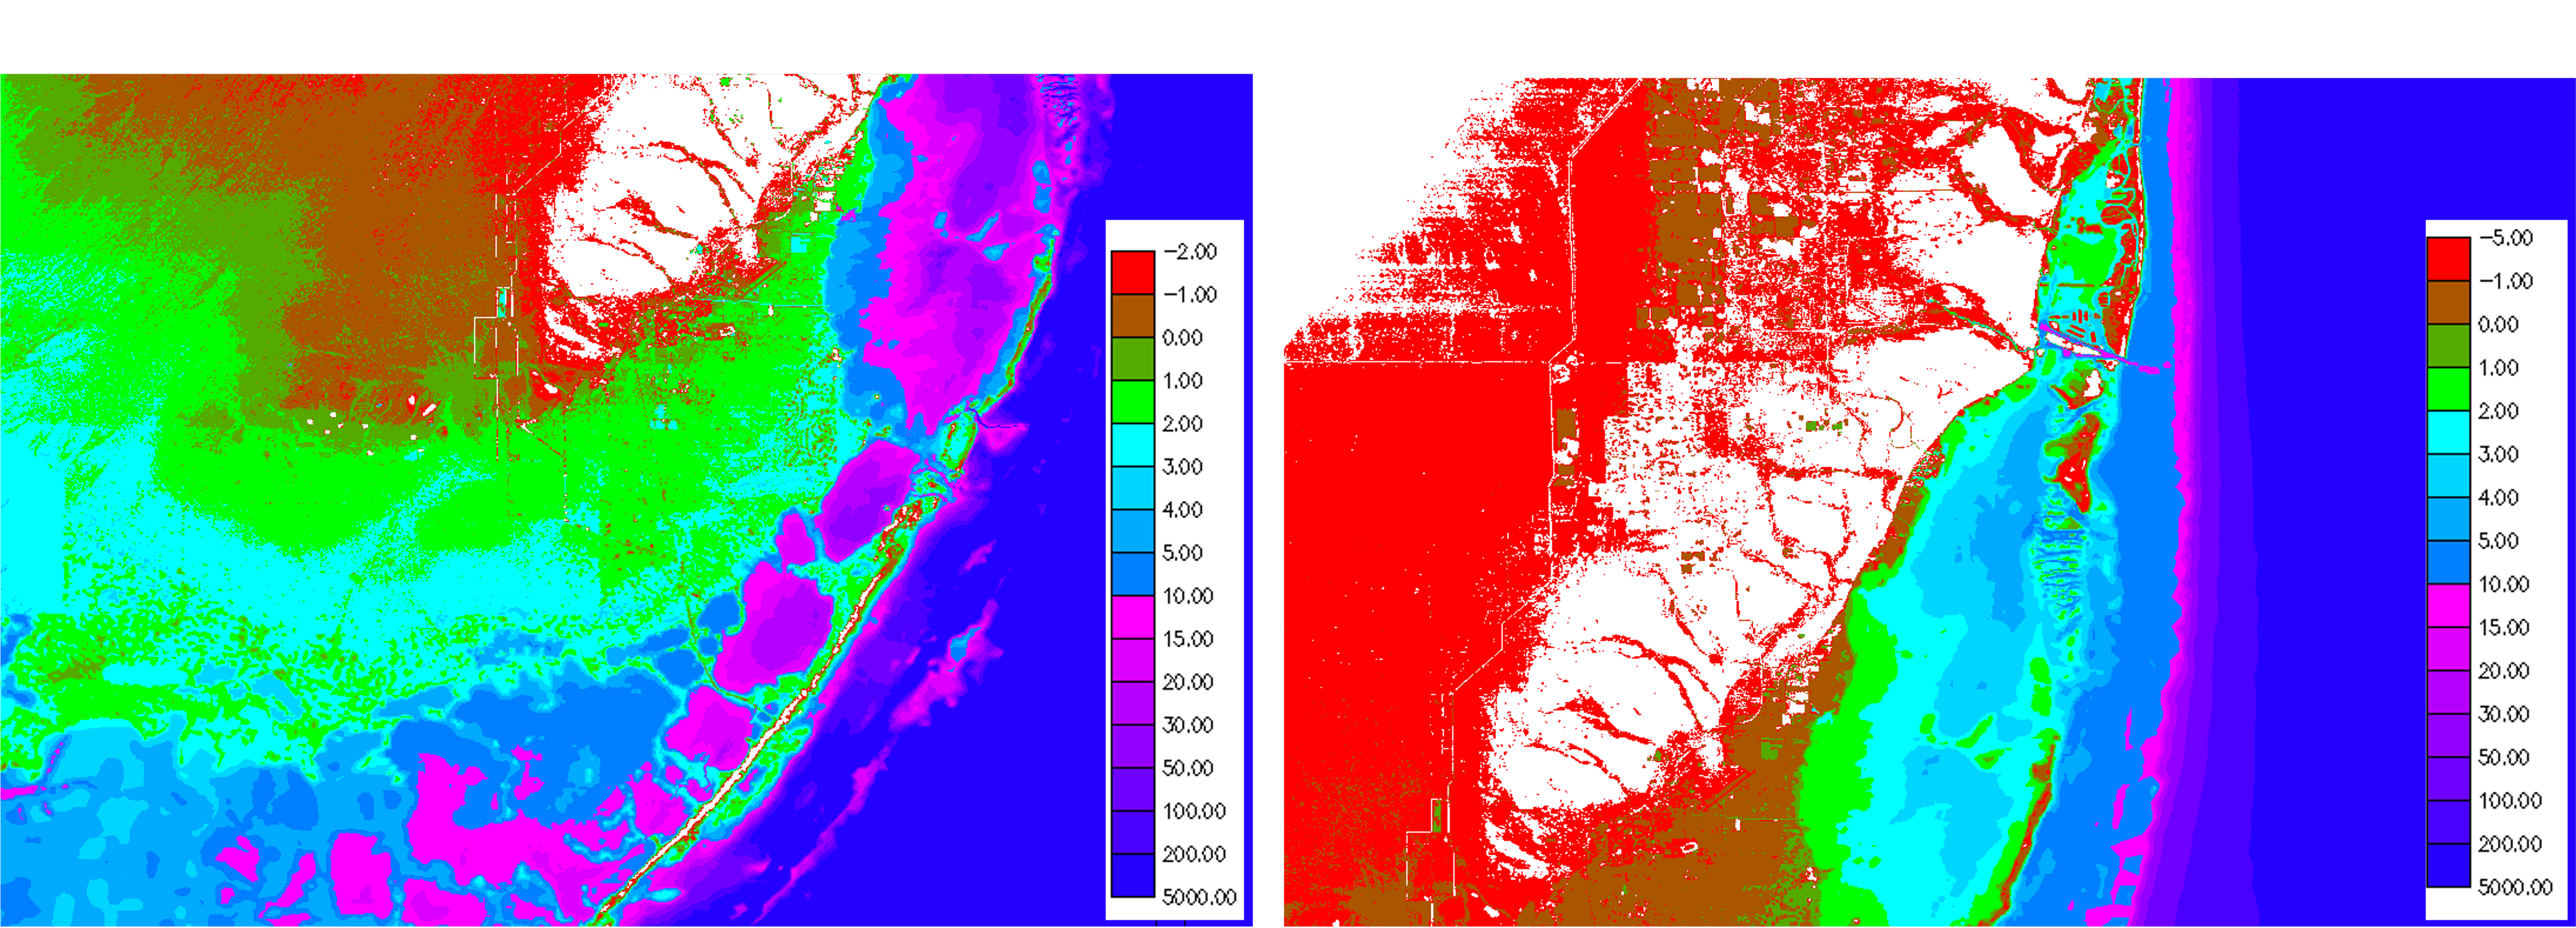 Figures above shows horizontal grid of SCHISM, covering both inland watershed and coastal open ocean with flexible resolution ranging from 1m to a few kilometers, thus resolving levees, canals, inlets, etc. the complex coastal systems across land to ocean continuum.
By comparing the modeled water level with observed water level at 12 NOAA station, the model successfully captured the storm surge during Hurricane Irma.
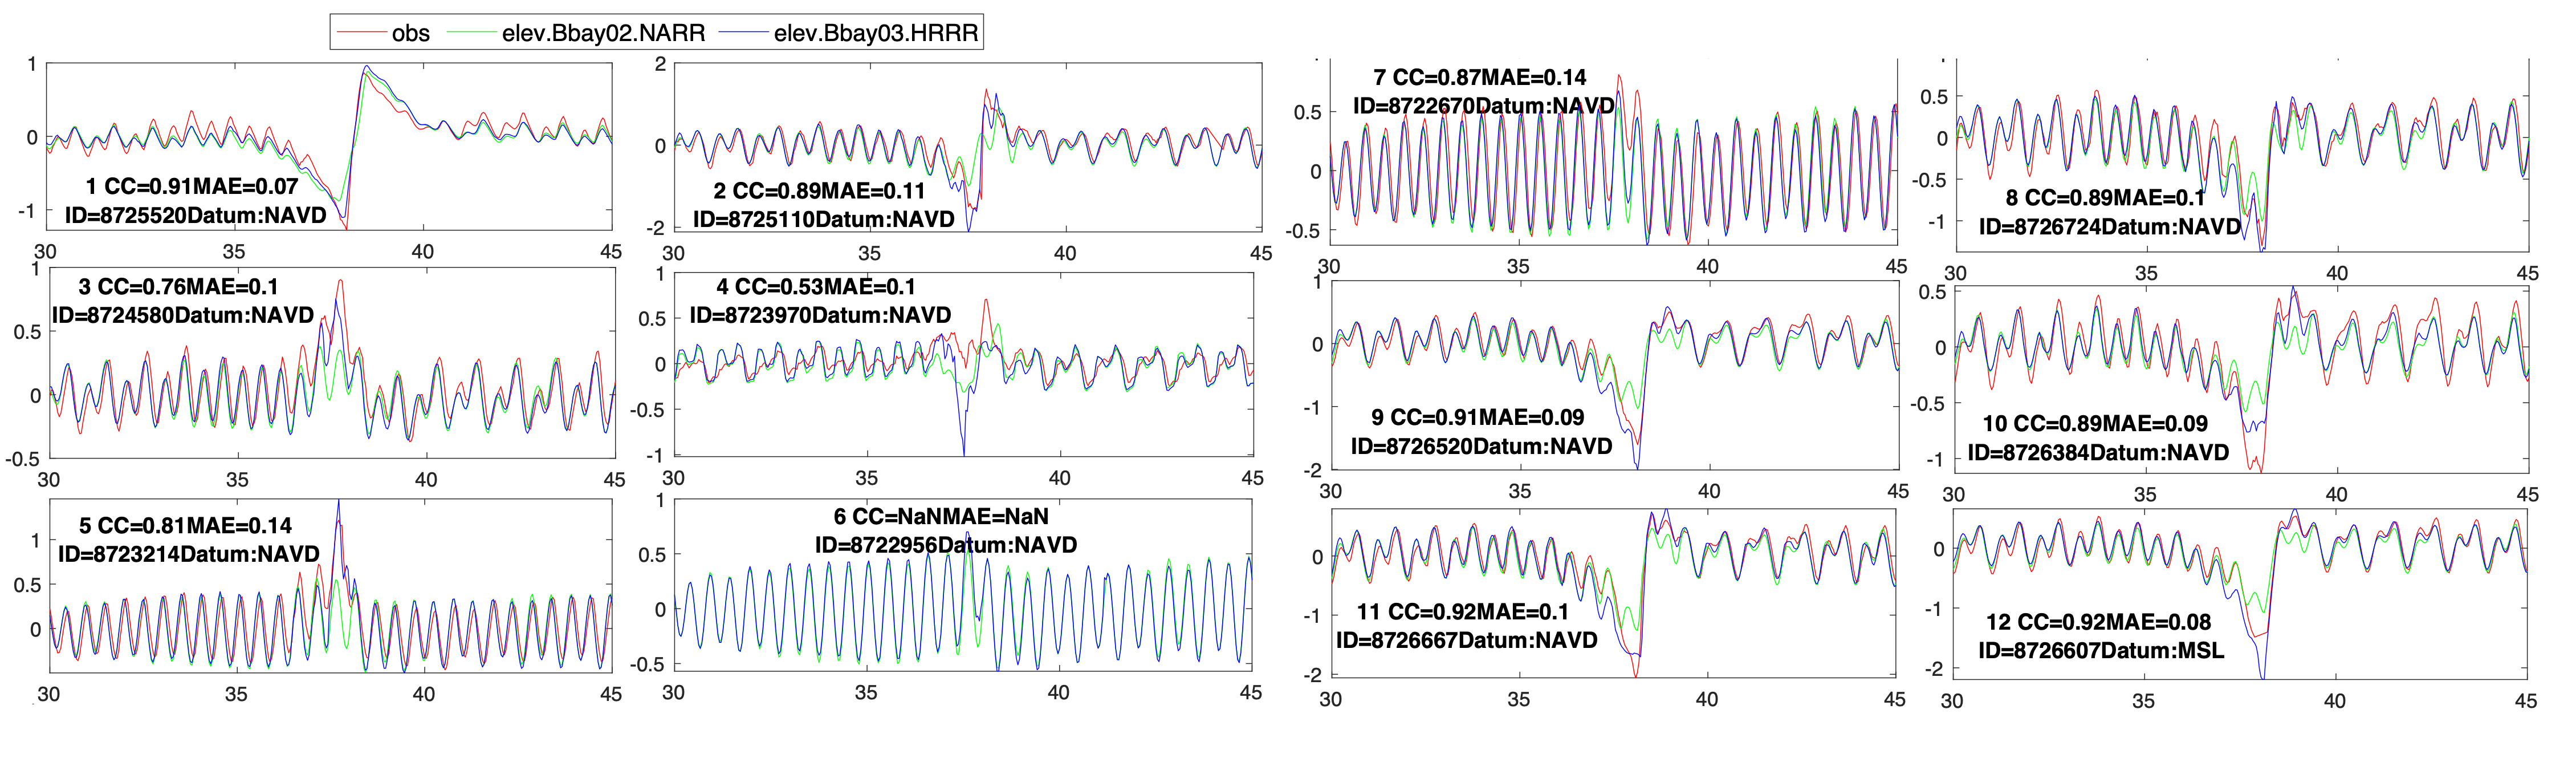
Figure above shows comparison between NOAA observation (red line) and simulated water level at 12 stations. Blue and green lines are simulated water level using HRRR and NARR atmospheric forcing, respectively. Results show that to accurately capture the storm surge, we need better atmospheric forcing.